1
2
3
4
5
6
7
8
9
10
11
12
13
14
15
16
17
18
19
20
21
22
23
24
25
26
27
28
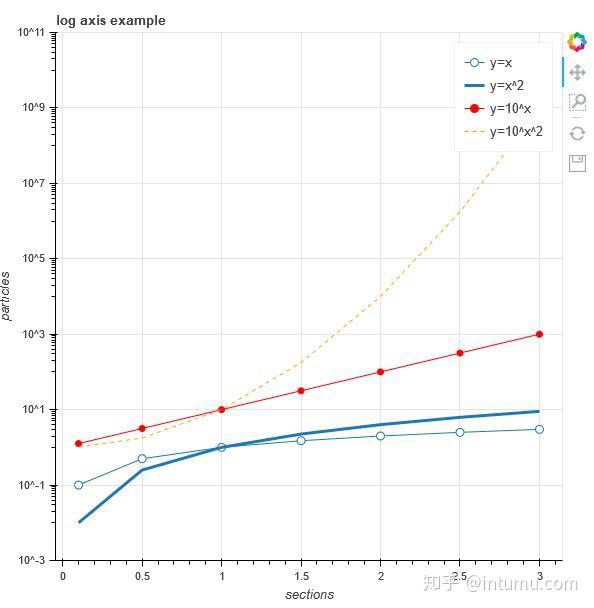
| from bokeh.plotting import figure, output_file, show
# 准备数据
x = [0.1, 0.5, 1.0, 1.5, 2.0, 2.5, 3.0]
y0 = [i**2 for i in x]
y1 = [10**i for i in x]
y2 = [10**(i**2) for i in x]
# 输出为静态的html
output_file("log_lines.html")
# 创建画布
p = figure(
tools="pan,box_zoom,reset,save",
y_axis_type="log", y_range=[0.001, 10**11], title="log axis example",
x_axis_label='sections', y_axis_label='particles'
)
# 添加曲线
p.line(x, x, legend="y=x")
p.circle(x, x, legend="y=x", fill_color="white", size=8)
p.line(x, y0, legend="y=x^2", line_width=3)
p.line(x, y1, legend="y=10^x", line_color="red")
p.circle(x, y1, legend="y=10^x", fill_color="red", line_color="red", size=6)
p.line(x, y2, legend="y=10^x^2", line_color="orange", line_dash="4 4")
# 显示结果
show(p)
|